On Windows 10 like earlier Windows versions, you will find a Performance Monitor named application that analyzes, assembles, monitors and addresses the total state or health of our operating system. With the help of this application, you can organize the workings of your system.
When I checked Performance Monitor I experienced an interesting thing. The application had represented fact-based statistics along with a graphical representation of the system performance. So I will also share this piece of information with all my readers so that you can also get an overview report of your system’s working. You may like to read: Monitor PC Temperature, Memory, Network Usage to Boost Performance
Start and Use Performance Monitor on Windows 10
Get Into Performance Monitor on Windows 10
To begin the process, you will have to know the way through which you can get the entry to the Performance Monitor application. There are two ways of exploring Performance Monitor application.
The first method that I will show you is by getting into the Control Panel. In the Category View of the applet select Administrative Tools.

A new window of Administrative Tools will arrive on the screen. Among the items listed there look for Performance Monitor and double-click on it to open.
![]()
Another way is by launching Run command window. When you hit Windows and R keys Run command box will appear on the screen. Type perfmon.msc in the provided field and click Ok.

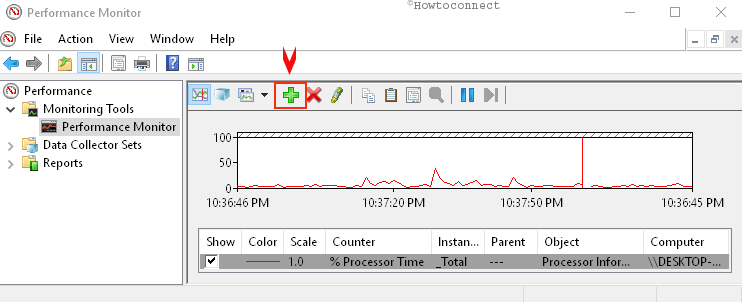
Use any of the ways and you are into the Performance Monitor. Take a look at the below screenshot for its first view.

Analyze Your System’s Performance on Windows 10
Navigate the following path on the left pane of the window – Monitoring Tools -> Performance Monitor.
Open some programs on your system so that you may be able to see your system’s performance when the programs are being active. The graph will represent you the effects of the programs on your system’s mechanism. As you have opened the Performance Monitor on Windows 10 for the first time so you will notice a graph. This graph represents the Processor Time. The amount of time is displayed in the graph is in terms of percentage. It shows the amount of time being consumed by the Processor when the programs are active on your system. The horizontal line depicts the time and the vertical line is the percentage used.

Performance Monitor allows you to add your required counters so that you can analyze its performance on your system. So click on the green-colored plus sign on the top of the window.
Add counters window will appear now. On the left pane of the window, you will a list of counters available. Scroll up and down to find your required counter (For instance, I have selected the Memory counter). Then click on Add button followed by Ok option.

You will view a complicated graph on your Performance Monitor on Windows 10 Don’t get scared with the graph. If looked carefully you will be able to understand its depth. In the lower half of the graph, you will notice many parameters whose performance is shown the above graph. The colors corresponding to each parameter are shown in the above graph with the same colors.
If you deselect any parameter then its performance will not be shown in the above graph. Many important parameters like Available Bytes or Committed Bytes are displayed.

For the users who are getting confused with so many colored lines, (I suppose we all are getting confused ;-)) there is a way to make things bit clear. You can view the details in Histogram bar or in Report. When you give a click on the downward arrow located beside the green colored plus sign you will notice three options – Line, Histogram bar and Report.
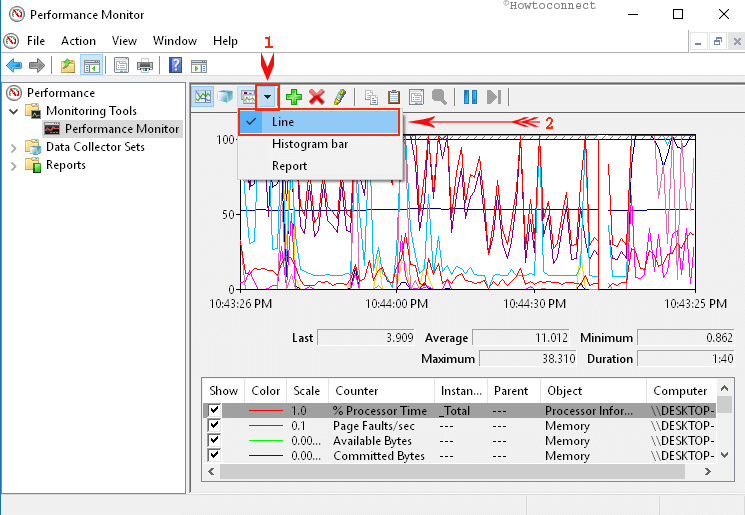
To view the details in the Histogram Bar select Histogram bar option.

To get the Report click on Report option.

CONCLUSION
I know understanding it is not an easy task and so I request you all to know the casual reports only. You will at least be able to keep track of your system’s performance. Though a tough job if you try then it will be helpful.
RECOMMENDED: Click here to fix Windows errors and improve PC performance
@excellentshyguy : Did you ever get a reply to your question? I am looking for the same and have not yet found a way to actually print out the results from the report itself in to for example pdf-file or textfile.
Try once more.
I have tried to generate a performance monitor report on my Windows 10 desktop. I type in perfmon /report and get the initial screen showing the 60-second wait time but that’s it. The next screen, generate the report, does not appear even after a couple hours of waiting. Is there a service that may or may not be active or disabled that I need to activate in order for this report to appear?
Just to let you know, I have generated a report earlier in the week but have been experiencing the above difficulties since that one report was generated.